The Current State of British Energy
- 1.7 million UK homes did not turn their heating on at all last winter, nearly double from the previous year1
- Cold homes cause roughly 5,000 excess deaths yearly, accounting for over 20% of all winter-related deaths2
- UK electricity generation fell by 2.6% in 2024 to 285 TWh, the lowest since 1983
- Growing electricity demand is now filled by record imports, up 40% to 33.4 TWh3
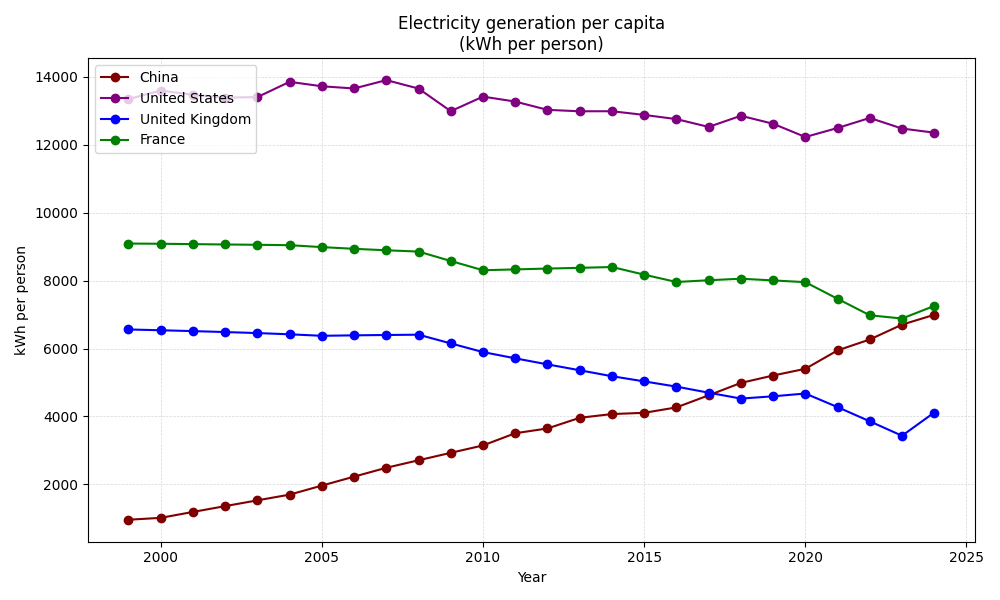
- Per person electricity generation has dropped over 20% since 20054
- UK electricity use per person is closer to Brazil and South Africa than to Germany, China, Japan, Sweden, or Canada5
- Nuclear power supplies just 12.5% of Britain's electricity, while France gets 70% from nuclear and exports 10% of its production6
- French state-owned EDF controls Britain's remaining nuclear plants, meaning UK bill-payers subsidise French consumers7
- Britain opened its last nuclear plant in 19958, while China now operates meltdown-proof reactors9
- Hinkley Point C costs 4-6 times more per megawatt than South Korean nuclear plants10
- Today's Grid Upgrade moves at half the pace of the 1950s Supergrid and just 20% of the original National Grid's speed
- Gas prices dictate wholesale electricity prices 97% of the time, leaving the UK exposed to global price shocks11
- Renewable subsidies exceed £10 billion yearly, with billions more in transmission and balancing costs12
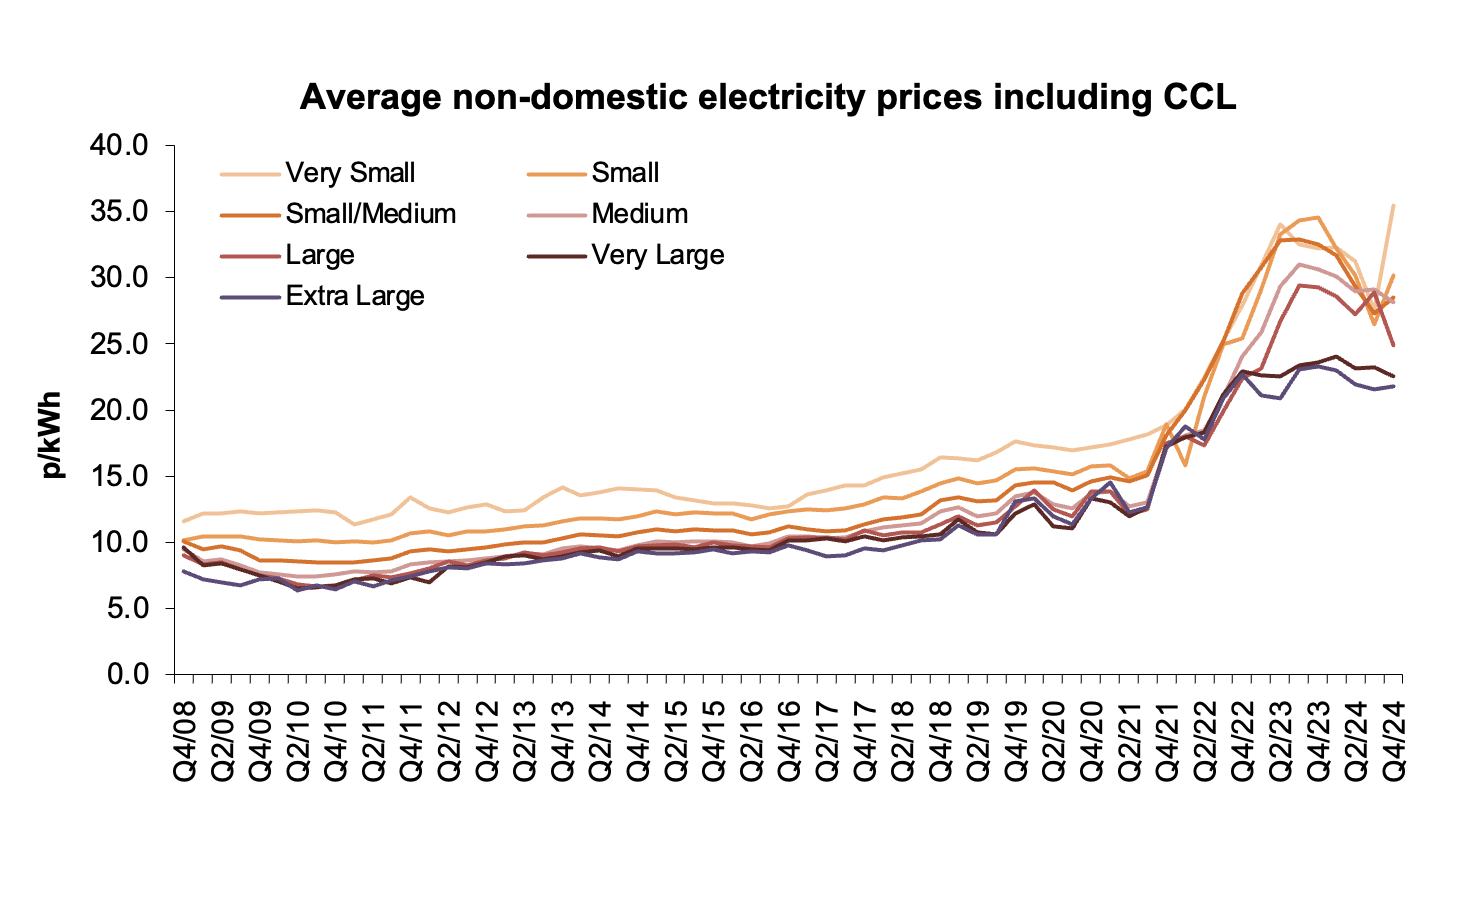
- UK manufacturers pay 18.4 pence per kilowatt-hour for electricity, 34% more than in France (13.7p)13
In 1954, Lewis Strauss claimed electricity would soon be “too cheap to meter.” It never happened. UK energy prices have risen far faster than inflation.
Between 2004 and 2021, before Russia's invasion of Ukraine, the industrial price of energy tripled in nominal terms, or doubled relative to consumer prices.14
Electricity generation in Britain has fallen to the lowest level since 1983. Imports are rising. In 2024 alone, they jumped 40% from the year prior to 33.4 TWh. Per person electricity generation has fallen by over 20% since 2005. Our electricity use per person (4.5 MWh) is closer to Brazil (3.43 MWh) and South Africa (3.67 MWh) than to developed economies like Germany (5.98 MWh), China (6.64 MWh), Japan (8.15 MWh), Sweden (13.03 MWh), or Canada (15.41 MWh). Efficiency gains of 1.6% a year since 2000 haven't offset the decline. We are energy poorer than we were 20 years ago.
Scarcity makes us poorer. UK industry pays a third more for electricity than France.
For many British families, the reality is starker. In 2024, 1.7 million homes never switched on the heat. That is almost twice as many as the year before. Cold homes kill around 5,000 people each year and make many more sick. Elderly people huddle in single rooms. Parents choose between heating and eating. These aren't inevitable outcomes; they are the consequences of a system that treats abundant energy production as an afterthought.
Britain wasn't always like this. We used to be pioneers. In 1926 we built the first national grid. In 1956 we built the first commercial nuclear power plant that fed a national grid. We created the Supergrid and reached peak electricity infrastructure spending in 1967. By the mid-1960s we had 21 nuclear reactors - more than the rest of the world combined!
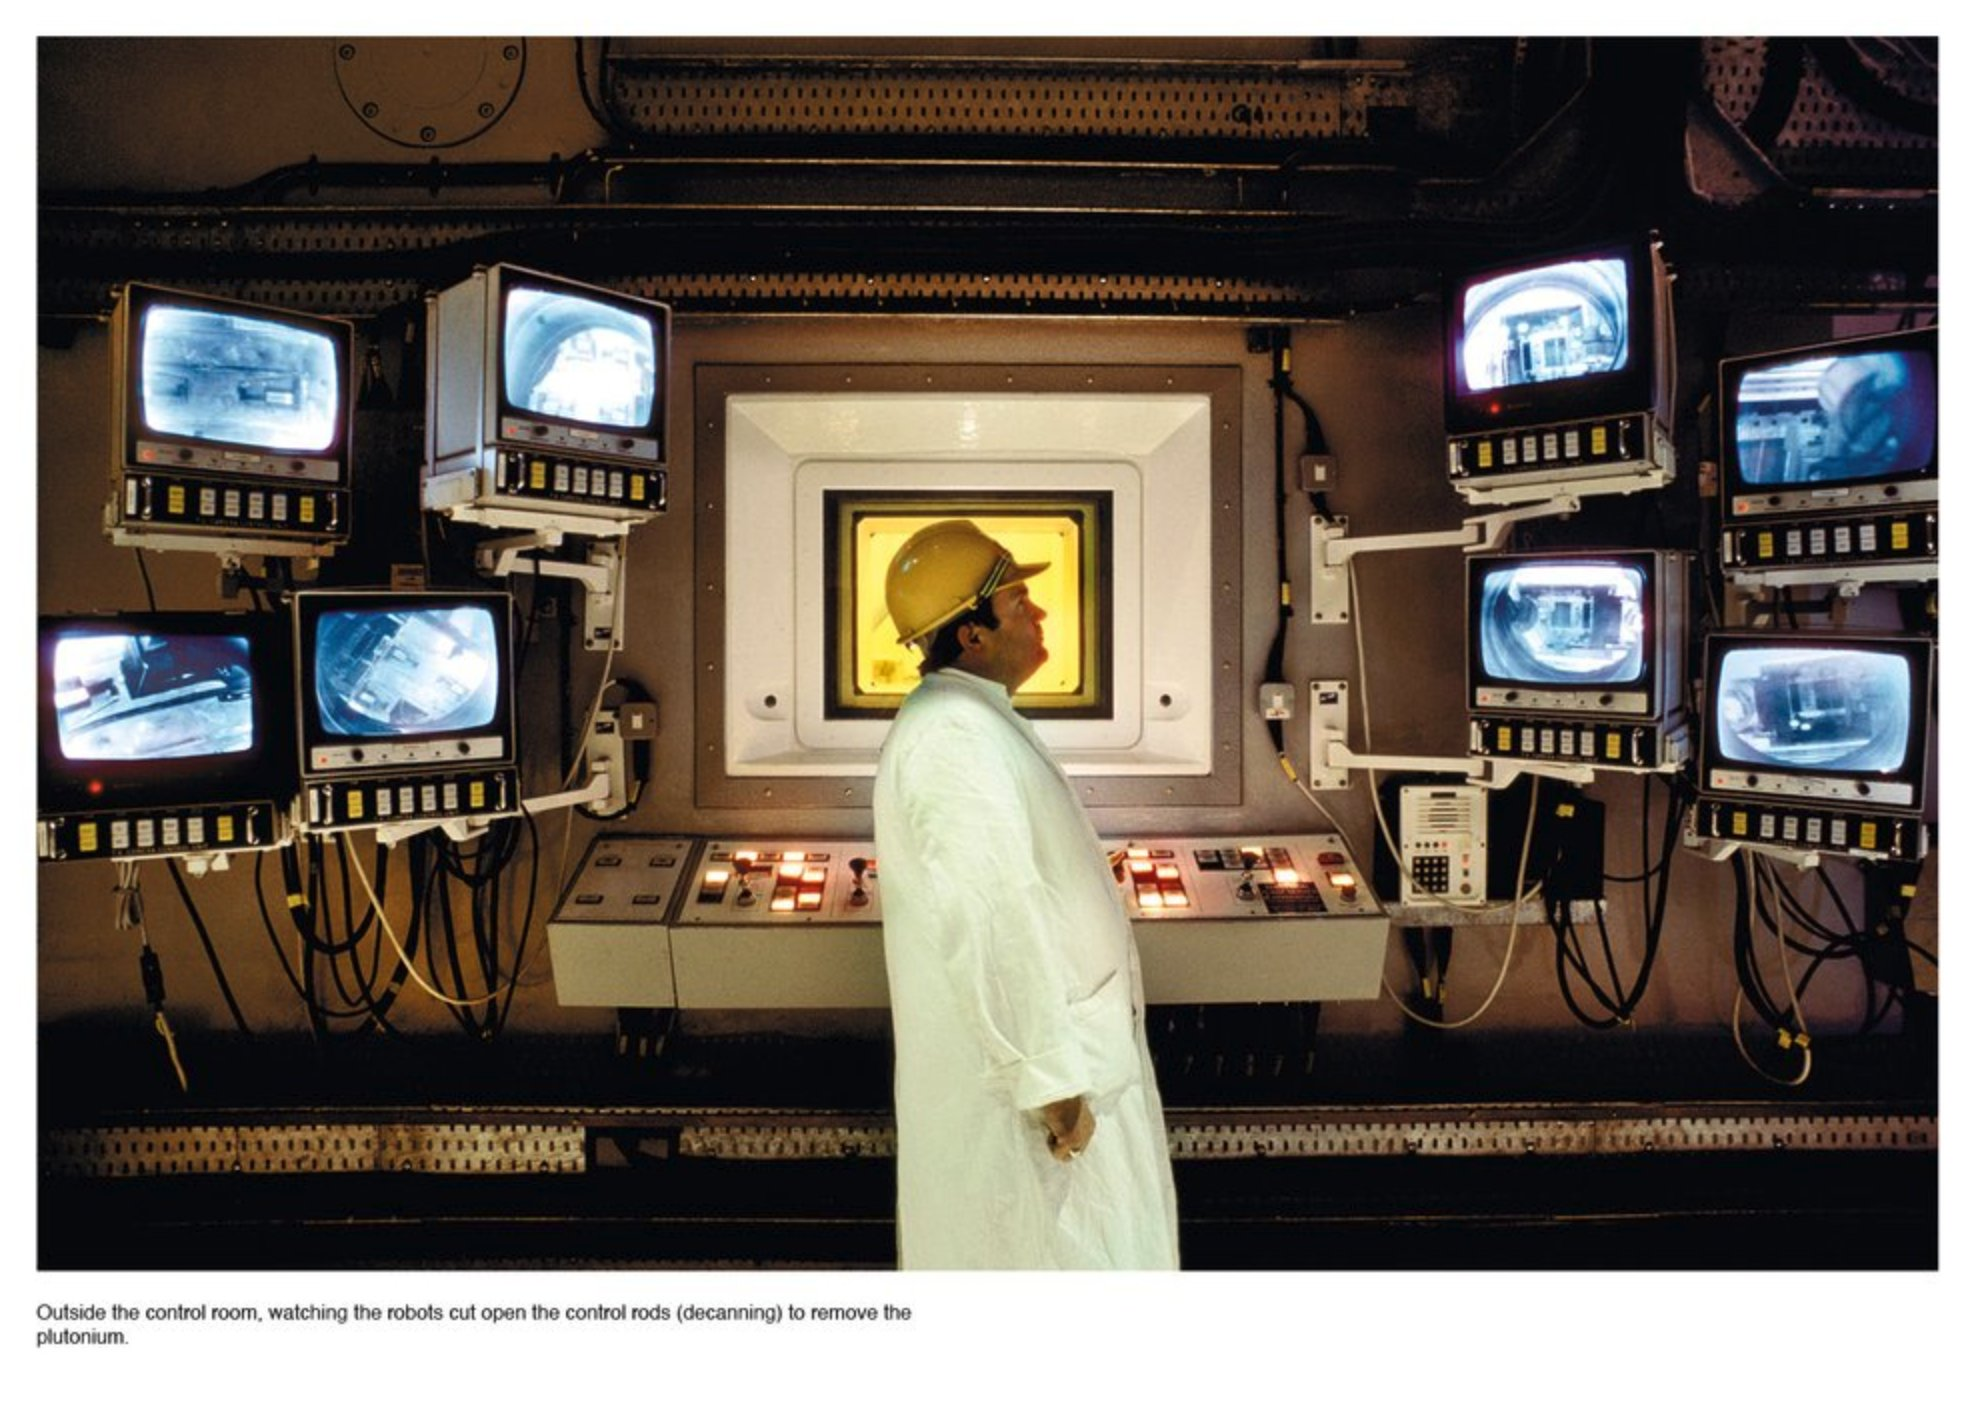
Photo credit: Barry Lewis15
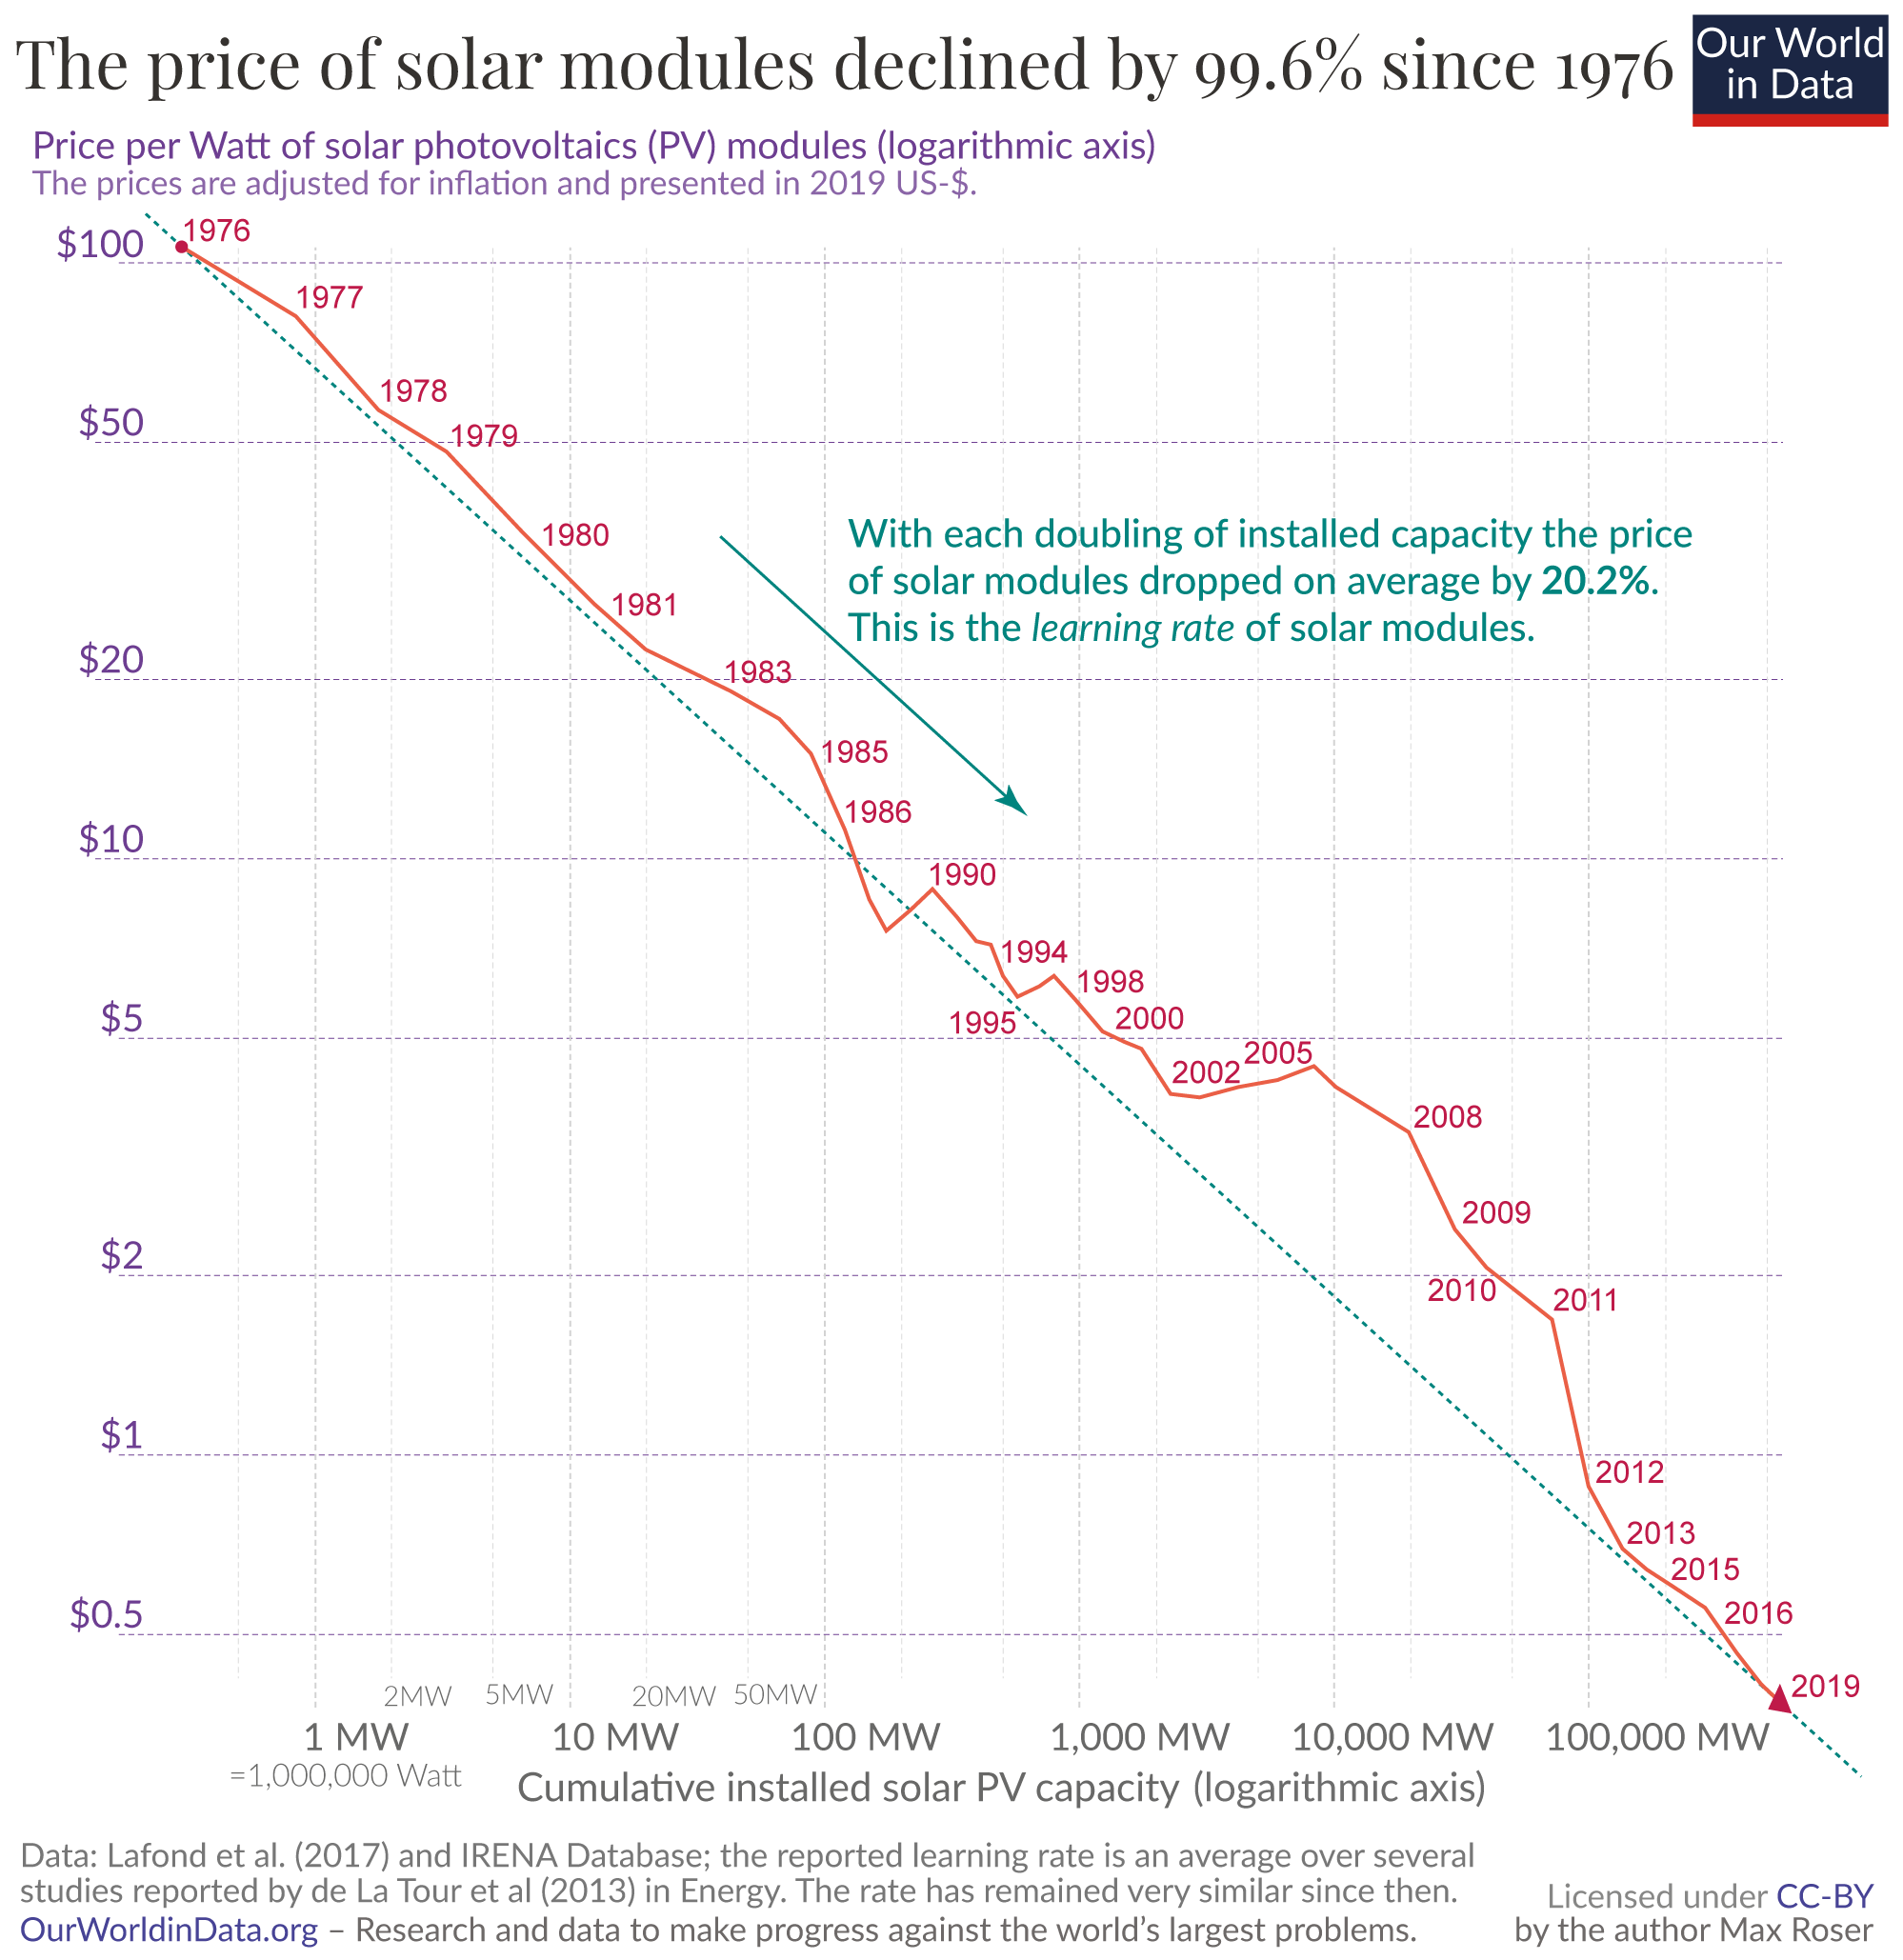
Why solar works
Solar keeps getting cheaper. Every doubling of global capacity cuts module prices by about 20 percent16. This is called a "learning curve" – the more we make of something, the better we get at making it cheaply. That's why solar is now the cheapest electricity in many countries17. Panels are small, modular, quick to install, and cheap to maintain. Batteries shift midday peaks into the evening. The result is the lowest‑cost electricity in many countries.
This combination of steep learning curves, modularity, daily cycles and low risk explains why solar will soon dominate global electricity generation alongside nuclear.
Why wind lags
Wind costs have not fallen much, only around 8 percent per doubling of capacity. Offshore projects become more expensive as turbines grow. Turbines are not modular, require bespoke infrastructure for each generation, and have high maintenance costs. Output is tied to long weather systems and is correlated across Europe, making it harder to balance without massive storage or backup.
Add dunkelflaute, periods when both wind and solar output are low simultaneously, often lasting days in winter and a limited shallow seabed, and the high cost and technical risk of floating turbines and you have something that looks an expensive addition to gas.
Why the UK Can't Run on Solar Alone
Short winter days mean December output is one‑sixth of June. Meeting winter demand with solar alone would require huge overbuild or seasonal storage. Imports from sunny regions could help, but the government has turned down projects such as X‑Links. Solar should still play a big role – rooftops, car parks, brownfields – but our geography means it can't carry the load.
Cost is more than generation price
The real metric is the value‑adjusted cost of electricity, or VALCOE. This includes generation, backup, grid connections, stability services, and curtailment costs. Offshore wind and carbon capture often cost far more than their headline prices once these factors are included.
Wind and solar are not enough
In Britain, wind and solar outputs are only weakly anti‑correlated18. A renewables‑only system still needs three full stacks: solar, wind, and dispatchable backup, to ride out multi‑day periods of low output. That is not cheap.
Policy mistakes
Britain's current policy of long‑term contracts for difference (CfDs) for offshore wind is locking us in high electricity prices. CfDs de‑risk projects, but if costs don't fall dramatically, consumers could be paying high strike prices for decades. Meanwhile renewable generation is racing ahead elsewhere: official statistics show that renewables produced 144.7 TWh in 2024, 50.8% of Britain's electricity19. If other countries can deploy cheap solar while we commit to expensive wind, we will lose competitiveness even more.
Hydrogen pipelines are vastly more expensive than gas networks and prone to leaks. Planning is broken. Grid connections take years and infrastructure approval is broken. The Lower Thames Crossing ran to 359,000 pages of documentation. Britain's next grid upgrade is slated to move at half the pace of the 1950s build‑out. The approval process alone can last longer than the construction. We have become masters of saying no.
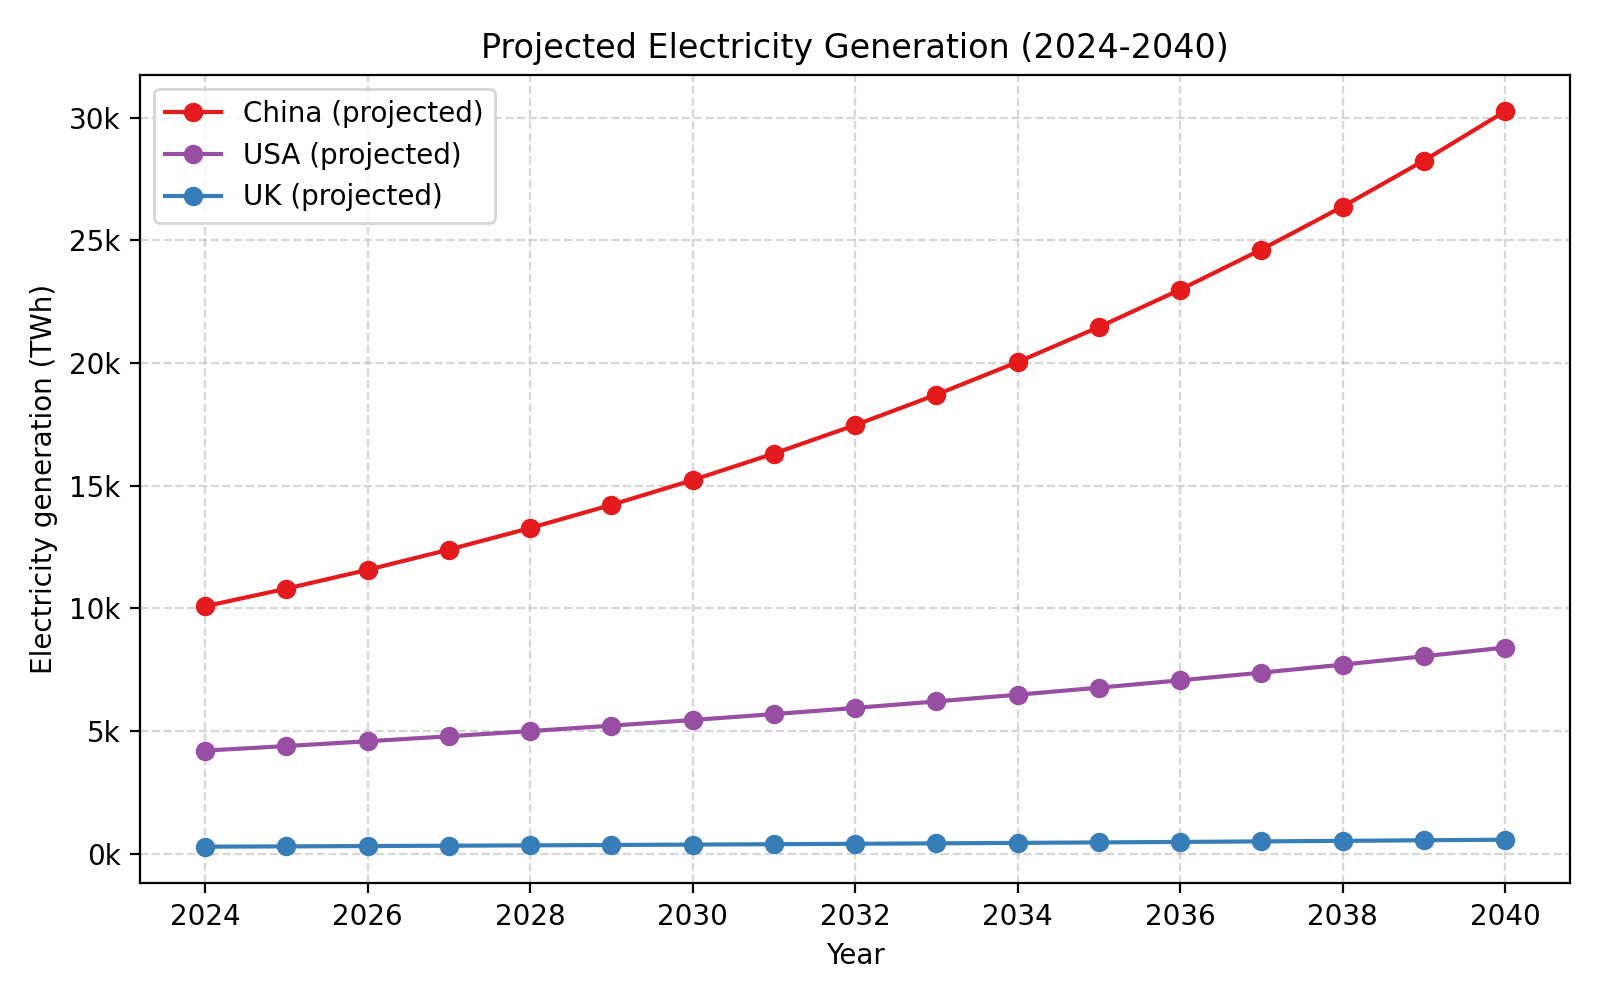
While we stall, other countries race ahead. America plans to double generation capacity by 2040. China plans to triple it.
Modular nuclear is the way out
Britain led the nuclear age and then stopped. Countries that kept building learned to drive costs down. South Korea builds Gen‑III+ reactors for a quarter of Hinkley's price. China is running a high‑temperature gas‑cooled reactor that we helped invent. Modern small modular reactors (SMRs) are designed to be built in factories and assembled on site. They are walk‑away safe and produce industrial heat as well as electricity. A modular nuclear programme could provide firm, zero‑carbon power at predictable cost, reducing the need for vast storage and backup. We just have to get back in the game.
KEPCO is constructing plants in the Czech Republic for less than half what we're paying at home. China has been running a 200 MW "meltdown-proof" reactor since 2022, built on technology the U.S. and U.K. pioneered but abandoned. We don't have to reinvent nuclear; we can learn from countries that still build it.
Emissions
Britain should also stop treating domestic carbon intensity as the sole goal. Gaia (earth) does not care which country emits them.
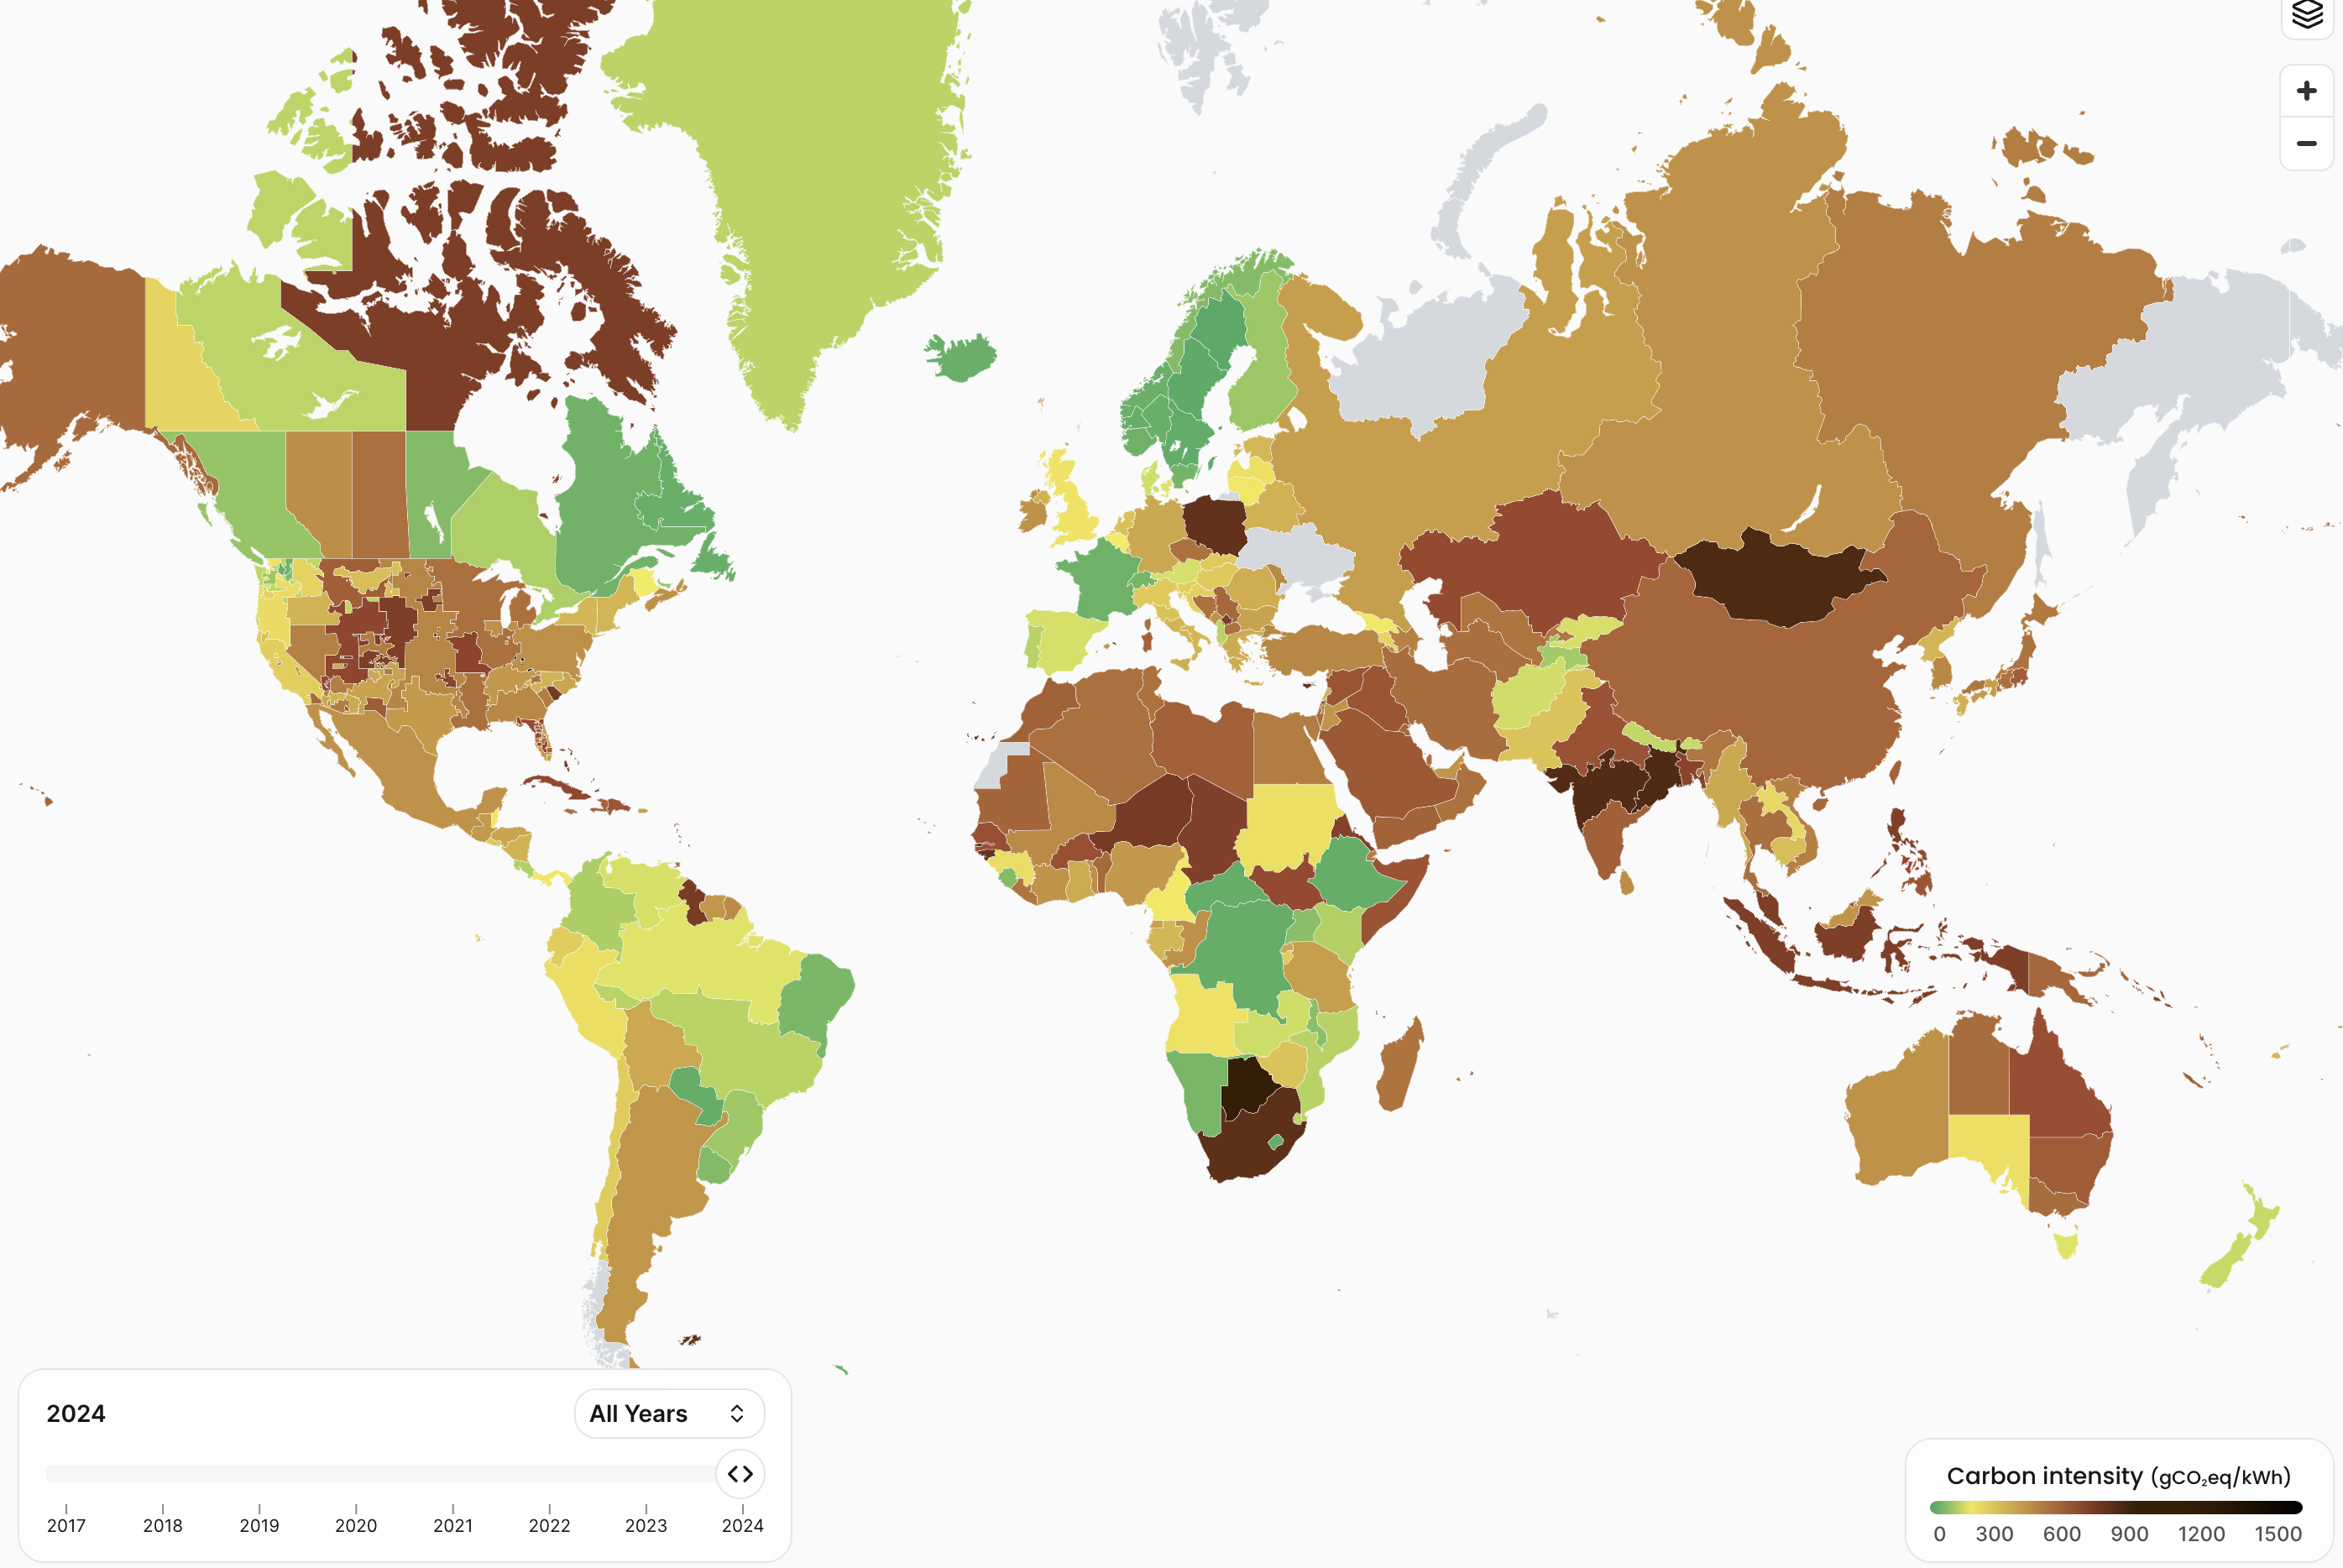
source: https://app.electricitymaps.com
Methane leaks from two gas wells in Turkmenistan did more warming in 2022 than the U.K.'s entire CO₂ output. Investing abroad in leak prevention or storage technology often yields bigger emissions cuts per pound than expensive domestic schemes. British steel produces 1.6 tons of CO₂ per ton versus China's 2.1.
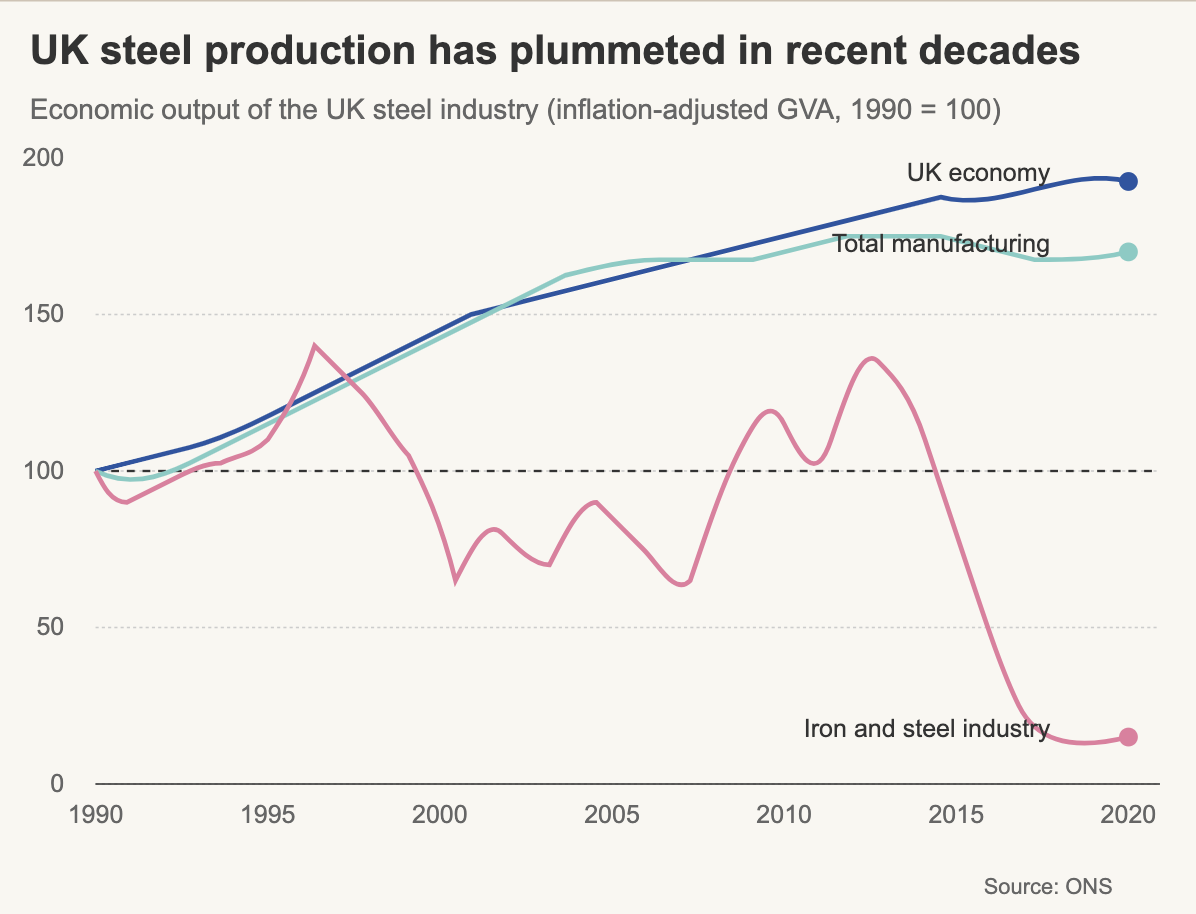
British aluminium emits 4 tons per ton versus China's 12.7. On a global scale, protecting and expanding U.K. manufacturing saves carbon.
What to do now
- Approve lines and plants in months, not years.
- Train and retain nuclear engineers.
- Use zonal pricing to cut curtailment costs.
- Pay EVs to feed power back to the grid.
- Scrap the Climate Change Levy on electricity.
- Invest in UK manufacturing and global methane‑leak prevention.
- Rename the Department for Energy Security and Net Zero to the Department for Low‑Cost Energy.
Cheap, abundant energy means no one dies of cold. It keeps factories running, rebuilds industry, and lets us move from scarcity back to abundance. We did it before. We can do it again.
Footnotes
-
Surveys by Uswitch and reported by the Guardian and the Independent in late 2024 found that more than 1.7 million households planned not to turn their heating on in the winter of 2024/25, up from about 972,000 households who said they hadn't heated their homes the previous winter. ↩
-
Analysis by the End Fuel Poverty Coalition using official mortality data attributed 4,706 excess winter deaths in 2022/23 to cold, damp homes, which represented about 21.5% of excess winter deaths in England, Scotland and Wales. ↩
-
The Department for Energy Security & Net Zero's Energy Trends report shows that UK electricity generation fell 2.6% in 2024 to 285 TWh, making it the lowest since 1983, and that net imports increased by 40% to a record 33.4 TWh. ↩
-
An analysis by Carbon Brief found that per-capita electricity generation in the UK fell 24% between 2005 and 2018, the lowest level since 1984. ↩
-
World Bank/IEA data show that in 2023 the UK consumed about 4,135 kWh per person. Brazil (2,916 kWh) and South Africa (3,358 kWh) are indeed close, while Germany (≈6,000 kWh), China (~6,100 kWh), Japan (7,803 kWh), Sweden (12,122 kWh) and Canada (14,153 kWh) all use far more per person. ↩
-
The UK government's 2024 statistics show that nuclear generated about 40.6 TWh, or 14.25% of UK electricity. France derives about 70% of its electricity from nuclear energy and is the world's largest net exporter of electricity. ↩
-
EDF, majority-owned by the French state, acquired British Energy (which operated most UK nuclear stations) in 2008 for £12.5 billion. Under the Hinkley Point C contract, British consumers will pay a fixed "strike price" for electricity for 35 years. ↩
-
Sizewell B, the UK's only commercial pressurised water reactor, was built and commissioned between 1987 and 1995 and first synchronised to the grid on 14 February 1995. ↩
-
China's Shidao Bay demonstration plant consists of twin high-temperature gas-cooled reactors driving a single 210 MWe turbine. Construction began in 2011; fuel loading started in 2021, and the plant first generated electricity in December 2021. ↩
-
An analysis by the campaign group Britain Remade notes that Hinkley Point C is projected to cost £33 billion, about £10.03 million per MW of capacity, whereas South Korea has built similar reactors for about £2.24 million per MW. ↩
-
The Office for National Statistics summarised research showing that although gas-fired plants supplied 43% of UK electricity in 2021, they set the system price 97% of the time. ↩
-
We could not find official data confirming that annual renewable subsidies exceed £10 billion or that transmission and balancing costs add "billions more." Without such evidence, this claim should be treated with caution. ↩
-
The ONS notes that UK industrial electricity prices in 2023 were almost 50% higher than those in France and Germany. We were unable to verify the specific figures (18.4 pence vs 13.7 pence) from official sources, though the general point that UK industrial electricity prices are significantly higher is supported. ↩
-
Gov.uk Gas and Electricity Prices in the Non-domestic Sector; UK Foundations, Ben Southwood, Samuel Hughes, Sam Bowman ↩
-
Barry Lewis, photographer documenting industrial heritage and energy infrastructure. ↩
-
Historical analyses show solar photovoltaic module prices have consistently followed learning curves, with costs declining approximately 20% for each doubling of cumulative production capacity since the 1970s. ↩
-
According to IRENA's Global Energy Transformation report and various LCOE analyses, utility-scale solar PV has become the cheapest source of power in most parts of the world. ↩
-
Bett, P.E. and Thornton, H.E. (2016). The climatological relationships between wind and solar energy supply in Britain. Renewable Energy, 87, 96-110. ↩
-
Department for Energy Security and Net Zero (2024). Energy Trends: UK electricity generation by source. ↩